Help Us Investigate a Checkout Issue
Thank you for taking the time to help us! We’ve identified a rare issue where checkout can occasionally become stuck after clicking Pay Now. Because this only happens in certain situations and on certain devices, it can be difficult to diagnose without seeing what’s happening in the browser.
The instructions below will help you capture a Browser Network Trace (HAR) and a Console Log (.log) file. This allows our engineering team to see what happens behind the scenes at the moment the issue occurs.
Your privacy is important to us:
- We cannot see your credit card number or payment details
- The trace only includes technical network requests from your browser
- You can stop at any time
If any part of this feels confusing or uncomfortable, that’s completely okay. Our support team can walk you through these steps live or place your order for you instead.
As a thank-you for your time, we’ll apply a 10% discount to your order. Participation is completely optional.
Select Your Browser to Get Started:
Microsoft Edge
Capture a browser trace in Microsoft Edge
The following steps show how to use the developer tools in Microsoft Edge to capture a browser trace.
-
On the Sylvane website, navigate to the step prior to where the issue occurs. If we are testing a bug with the Pay Now button, then take all steps leading up to the point where you are ready to press that button, then continue to the next steps below.
-
Press F12 to launch Microsoft Edge DevTools. You can also launch the tools from the toolbar menu under More tools > Developer tools.
-
By default, the browser keeps trace information only for the page that's currently loaded. Set the following options so the browser keeps all trace information, even if your reproduction steps require going to more than one page.
-
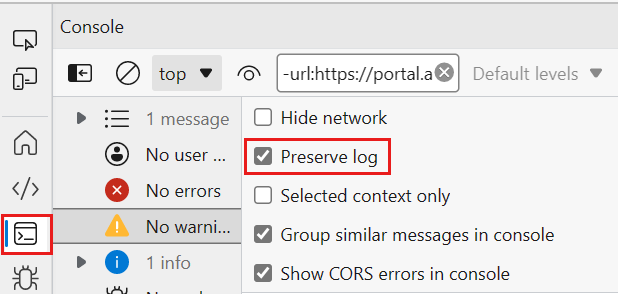
Select the Console tab, select Console settings, then select Preserve Log.
-
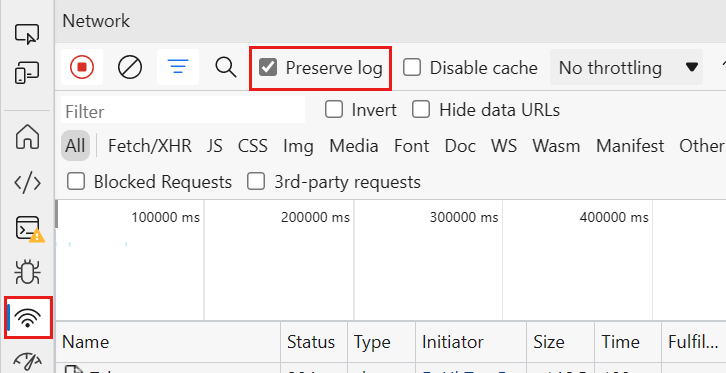
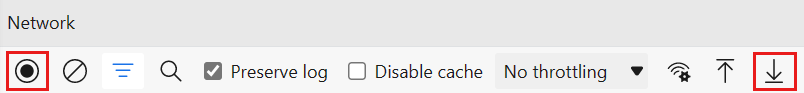
Select the Network tab. If that tab isn't visible, click the More tools (+) button and select Network. Then, from the Network tab, select Preserve log.
-
-
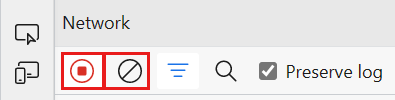
On the Network tab, select Stop recording network log and Clear.
-
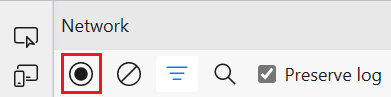
Select Record network log, then proceed to step 6.
-
Now, Reproduce the Error. For example, if you are reporting an issue where you click a button and it doesn't do what you'd expect. Then go to that step in your process and click that button. Make sure to reload the page if needed so that you can replicate the steps you took to make the error occur the original time.
-
After you have reproduced the unexpected behavior, select Stop recording network log again, then select Export HAR (sanitized)... and save the file. If you don't see the Export HAR icon, expand the width of your Edge developer tools window.
-
Back in the browser developer tools pane, select the Console tab. Right-click any one of the messages, then select Save as..., and save the console output to a text file.
-
Share the HAR file and the Console .log file with Sylvane's support team by attaching and sending an email to technology@sylvane.com
Google Chrome
Capture a browser trace in Google Chrome
The following steps show how to use the developer tools in Google Chrome to capture a browser trace.
-
On the Sylvane website, navigate to the step prior to where the issue occurs. If we are testing a bug with the Pay Now button, then take all steps leading up to the point where you are ready to press that button, then continue to the next steps below.
-
Press F12 to launch the developer tools. You can also launch the tools from the toolbar menu under More tools > Developer tools.
-
By default, the browser keeps trace information only for the page that's currently loaded. Set the following options so the browser keeps all trace information, even if your reproduction steps require going to more than one page:
-
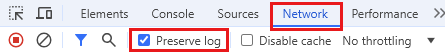
Select the Console tab, select Console settings, then select Preserve Log.

-
Select the Network tab, then select Preserve log.
-
-
On the Network tab, select Stop recording network log and Clear.

-
Select Record network log, then proceed to step 6.

-
Now, Reproduce the Error. For example, if you are reporting an issue where you click a button and it doesn't do what you'd expect. Then go to that step in your process and click that button. Make sure to reload the page if needed so that you can replicate the steps you took to make the error occur the original time.
-
After you have reproduced the unexpected behavior, select Stop recording network log, then select Export HAR (sanitized)... and save the file.

-
Back in the browser developer tools pane, select the Console tab. Right-click any one of the messages, then select Save as..., and save the console output to a text file.
-
Share the HAR file and the Console .log file with Sylvane's support team by attaching and sending an email to technology@sylvane.com
Safari (Mac)
Capture a browser trace in Safari
The following steps show how to use the developer tools in Apple Safari on Mac.
-
Enable the developer tools in Safari:
-
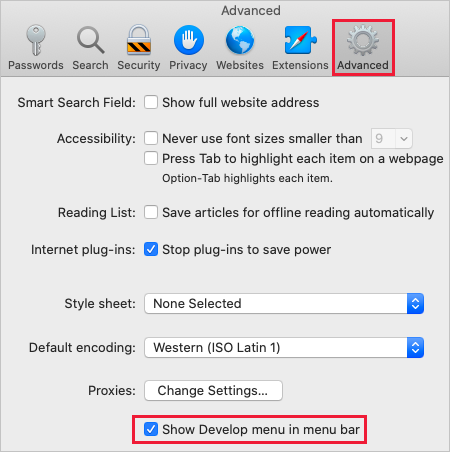
Select Safari, then select Preferences.
-
Select the Advanced tab, then select Show Develop menu in menu bar.
-
- On the Sylvane website, navigate to the step prior to where the issue occurs. If we are testing a bug with the Pay Now button, then take all steps leading up to the point where you are ready to press that button, then continue to the next steps below.
-
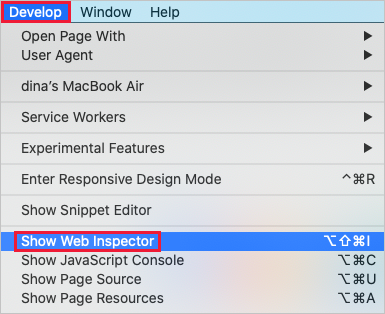
Select Develop, then select Show Web Inspector.
-
By default, the browser keeps trace information only for the page that's currently loaded. Set the following options so the browser keeps all trace information, even if your reproduction steps require going to more than one page:
-
Select the Console tab, then select Preserve Log.

-
Select the Network tab, then select Preserve Log.

-
-
On the Network tab, select Clear Network Items.

-
Now, Reproduce the Error. For example, if you are reporting an issue where you click a button and it doesn't do what you'd expect. Then go to that step in your process and click that button. Make sure to reload the page if needed so that you can replicate the steps you took to make the error occur the original time.
-
After you have reproduced the unexpected behavior, select Export and save the file.

-
Back in the browser developer tools pane, select the Console tab, and expand the window. Place your cursor at the start of the console output then drag and select the entire contents of the output. Use Command-C to copy the output and save it to a text file.
- Share the HAR file and the Console .log file with Sylvane's support team by attaching and sending an email to technology@sylvane.com
Firefox
Capture a browser trace in Firefox
The following steps show how to use the developer tools in Firefox.
-
On the Sylvane website, navigate to the step prior to where the issue occurs. If we are testing a bug with the Pay Now button, then take all steps leading up to the point where you are ready to press that button, then continue to the next steps below.
-
Press F12 to launch the developer tools. You can also launch the tools from the toolbar menu under More tools > Web developer tools.
-
By default, the browser keeps trace information only for the page that's currently loaded. Set the following options so the browser keeps all trace information, even if your repro steps require going to more than one page:
-
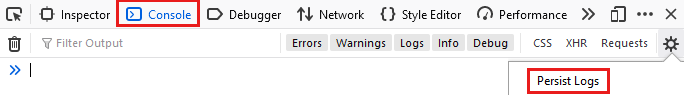
Select the Console tab, select the Settings icon, and then select Persist Logs.
-
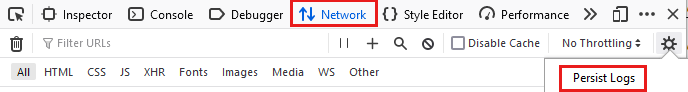
Select the Network tab, select the Settings icon, and then select Persist Logs.
-
-
On the Network tab, select Clear.

- Now, Reproduce the Error. For example, if you are reporting an issue where you click a button and it doesn't do what you'd expect. Then go to that step in your process and click that button. Make sure to reload the page if needed so that you can replicate the steps you took to make the error occur the original time.
-
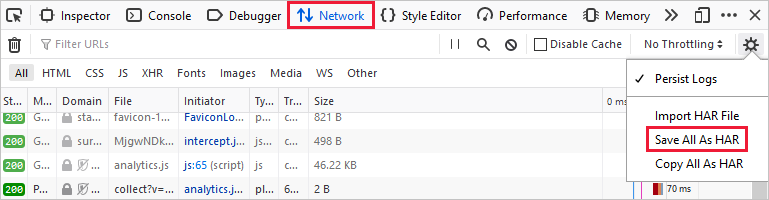
After you have reproduced the unexpected behavior, select Save All As HAR.
-
Back in the browser developer tools pane, select the Console tab. Right-click one of the messages, then select Save All Messages to File, and save the console output to a text file.
- Share the HAR file and the Console .log file with Sylvane's support team by attaching and sending an email to technology@sylvane.com